HYPERIONEnter Operator
← HomeMethodData sourcesModelingLimitations
Evidence / Context

Evidence
with context.

Hyperion does not turn one image into a claim. It combines measured water systems, terrain and event evidence, then delivers a probabilistic operating view.
Inputs / 04Grid / 50–100 mHorizon / 0–6 h
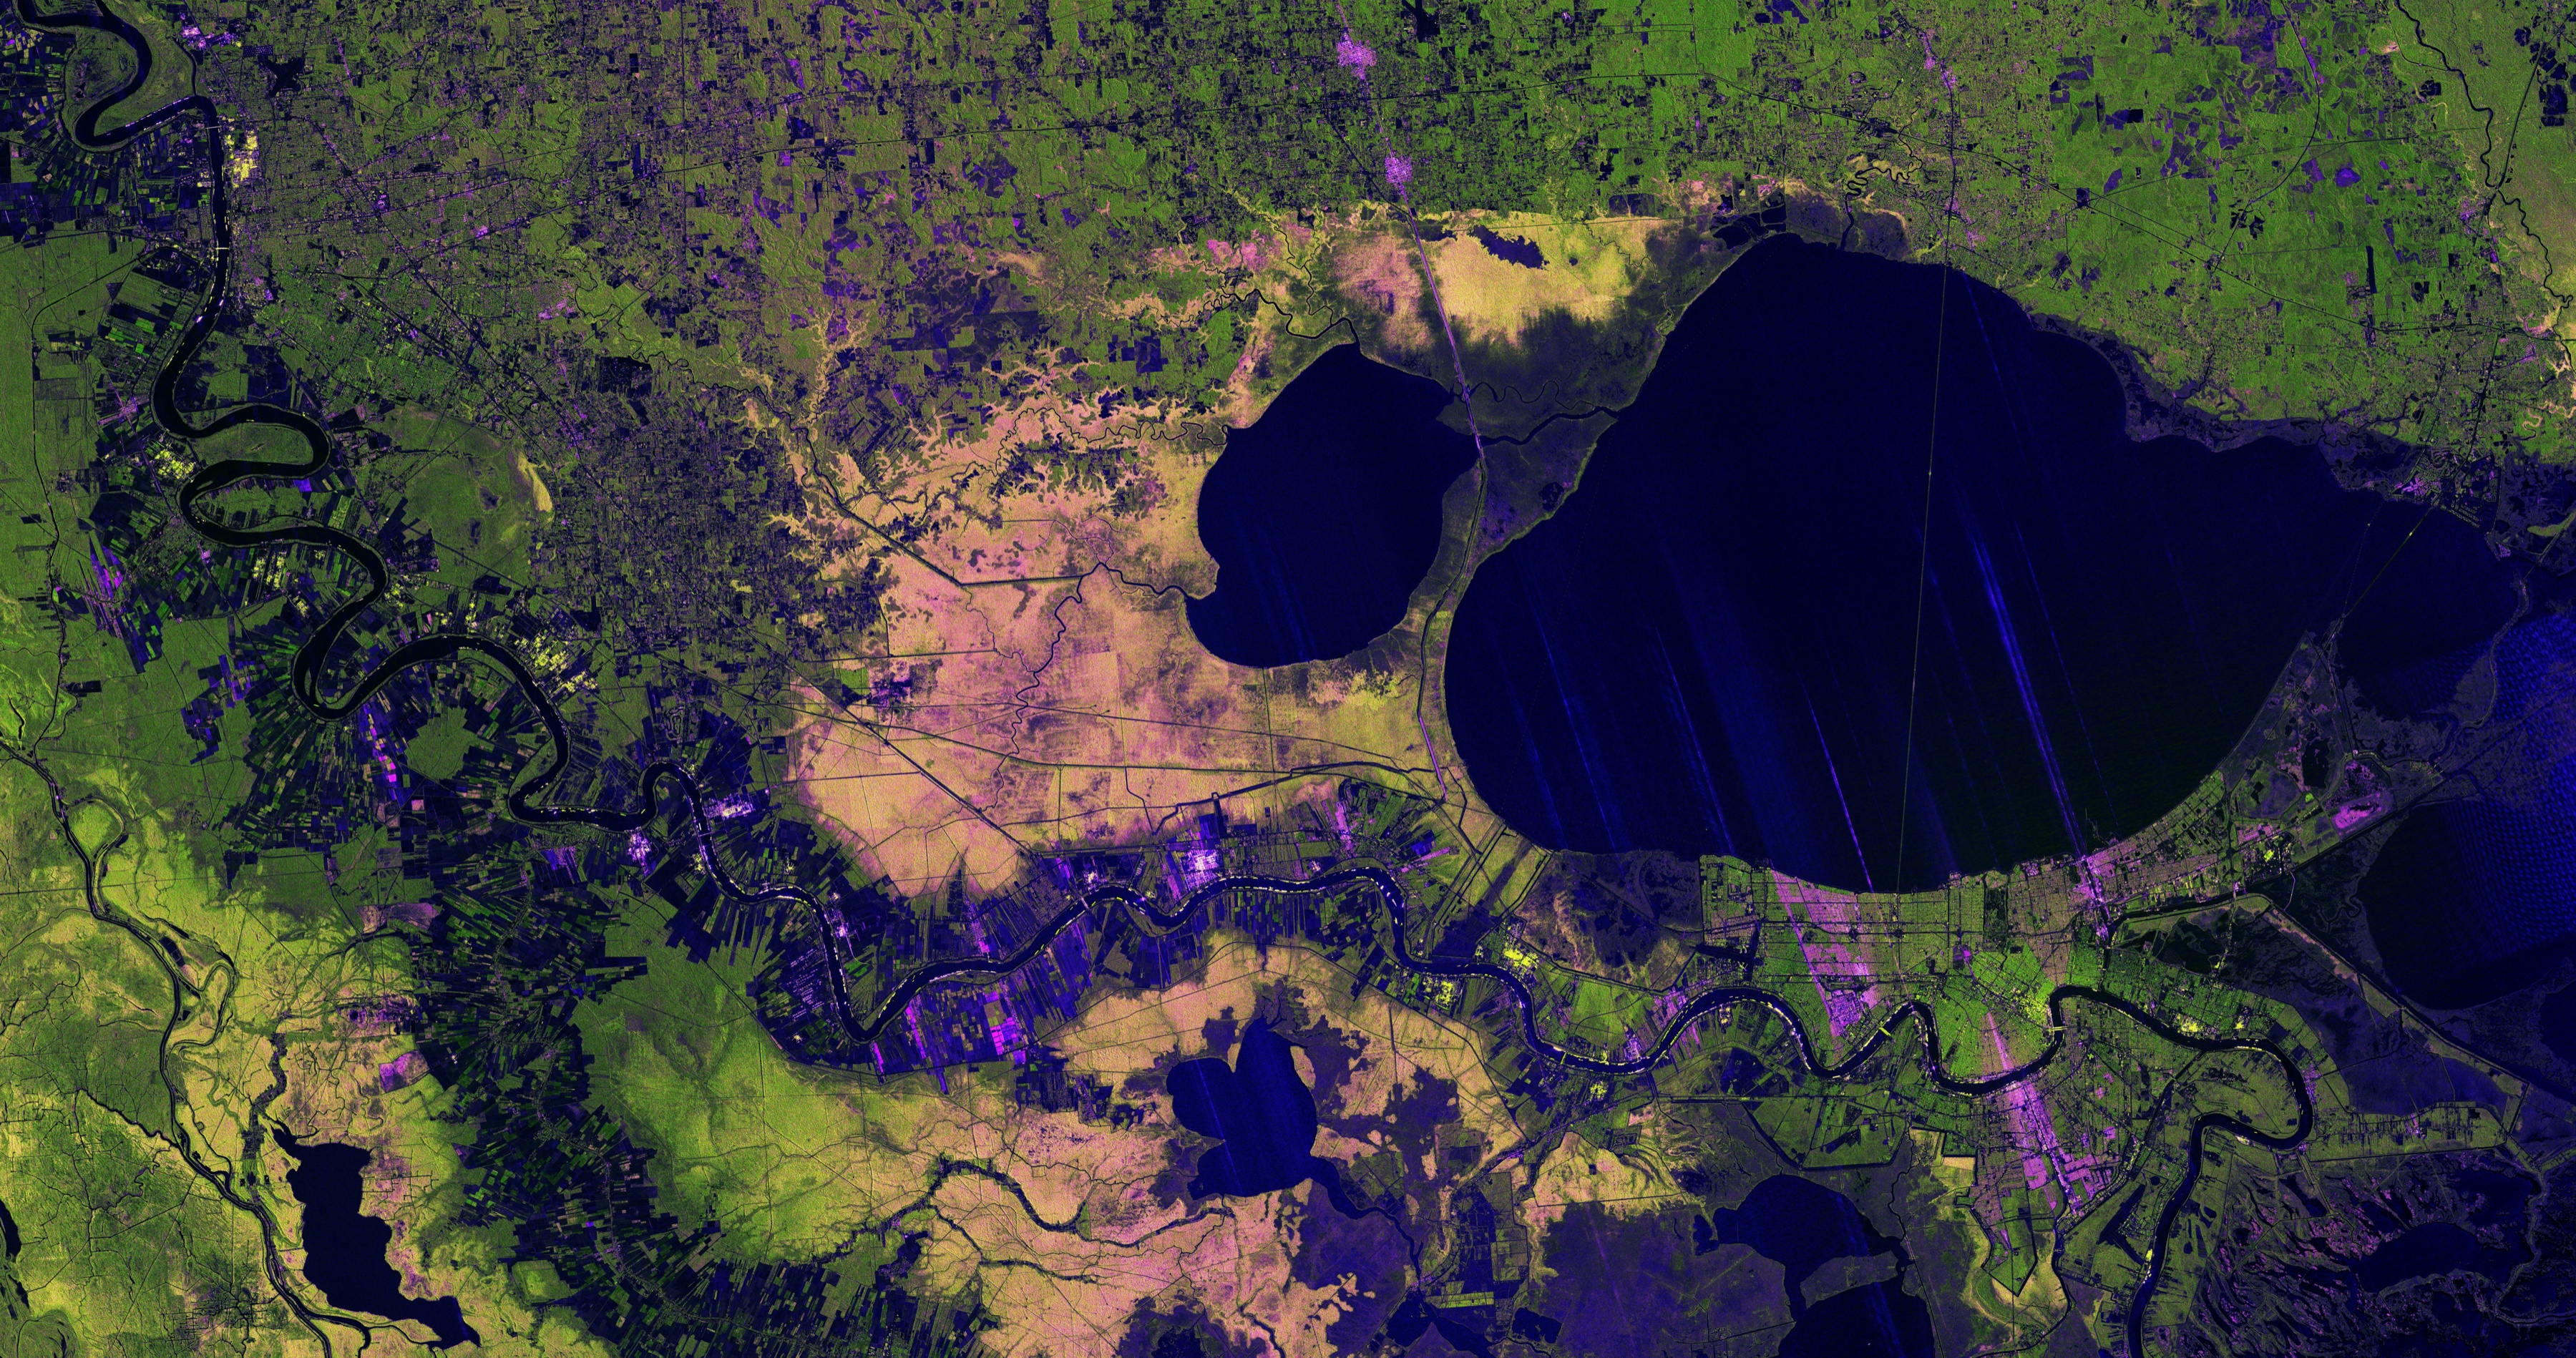
NISAR radar image showing the Mississippi River Delta and Louisiana wetlands
NASA / JPL · NISAR PIA26620Radar context for river, wetland and urban exposure.
What the images do

Context first. Claims second.

Optical and radar imagery help an operator orient the scene: coast, river, wetland, city and change. They are evidence around the system, not a replacement for the measured inputs or event labels.

See the operating contexts
How it works / 01

From physical signals
to an operating answer.

The same sequence is applied across every lab. Regional adapters change the data sources; the product contract stays stable.

01 / Inputs

Measure the four systems.

Rain, tide, river and terrain are collected from open federal sources and aligned to the lab grid.

02 / Modeling

Estimate what may compound.

Baseline and nowcast models produce a probability per cell. Labels are weak where they must be, and leakage checks stay outside production features.

03 / Calibration

Attach the uncertainty.

Temperature scaling, conformal intervals and a dual-gate ops alert keep the signal honest.
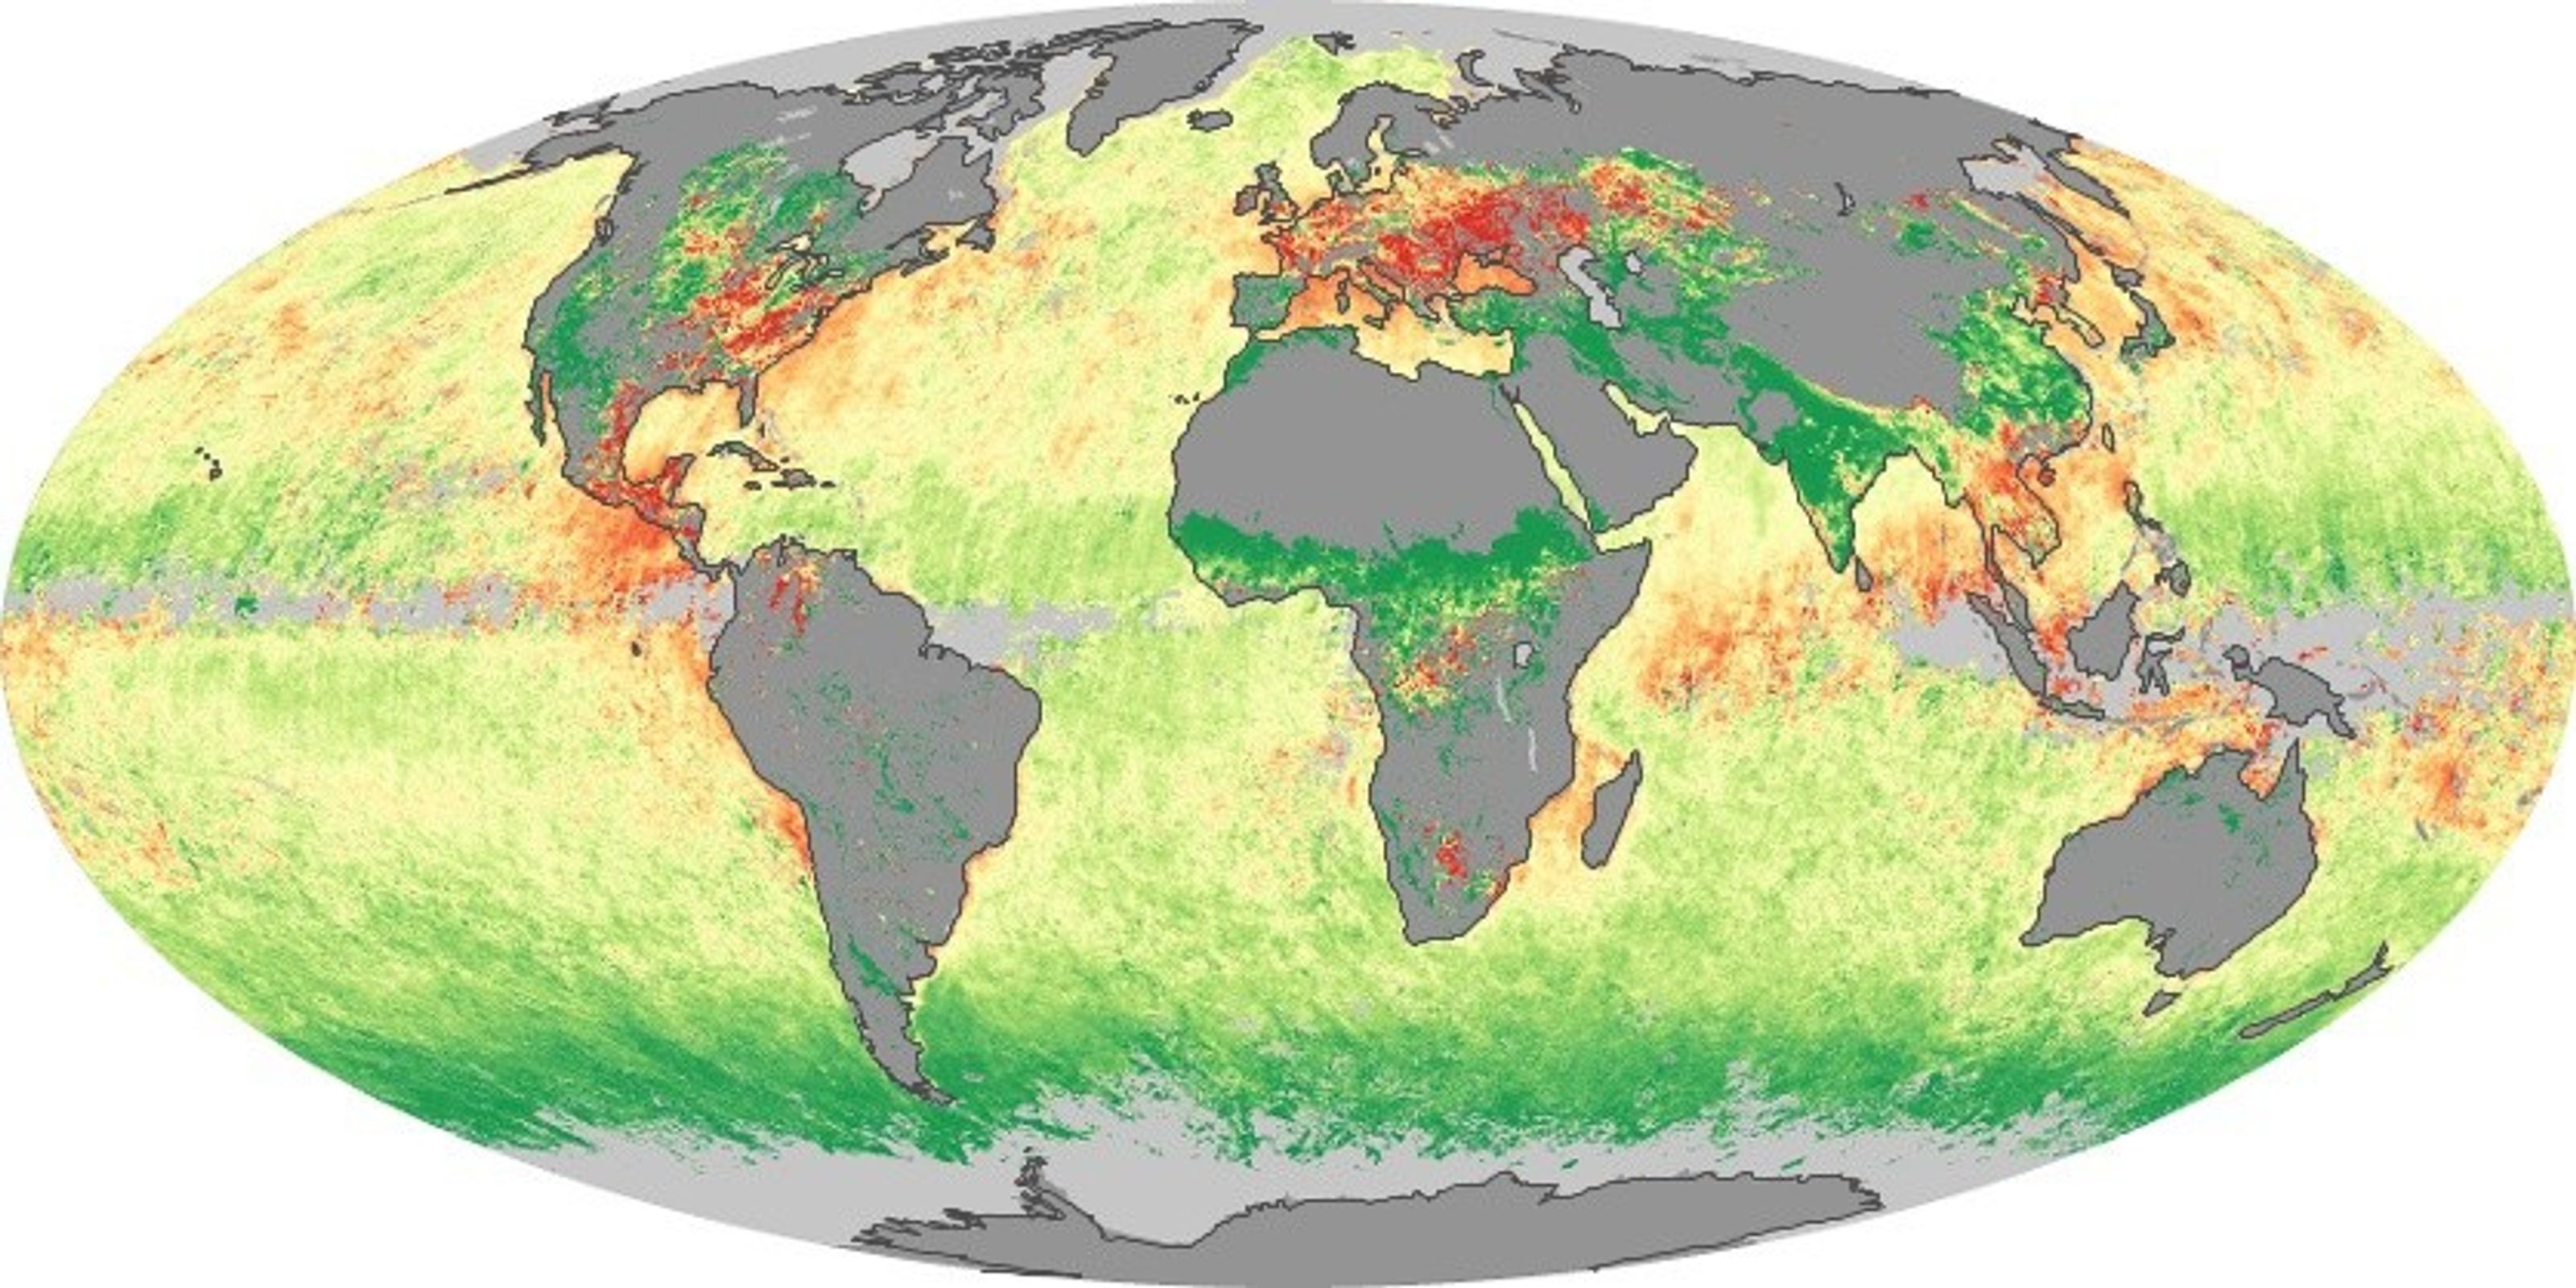
NASA GPM global rainfall map
01RainNOAA NEXRAD / MRMS / ASOS

Observed and short-horizon precipitation.
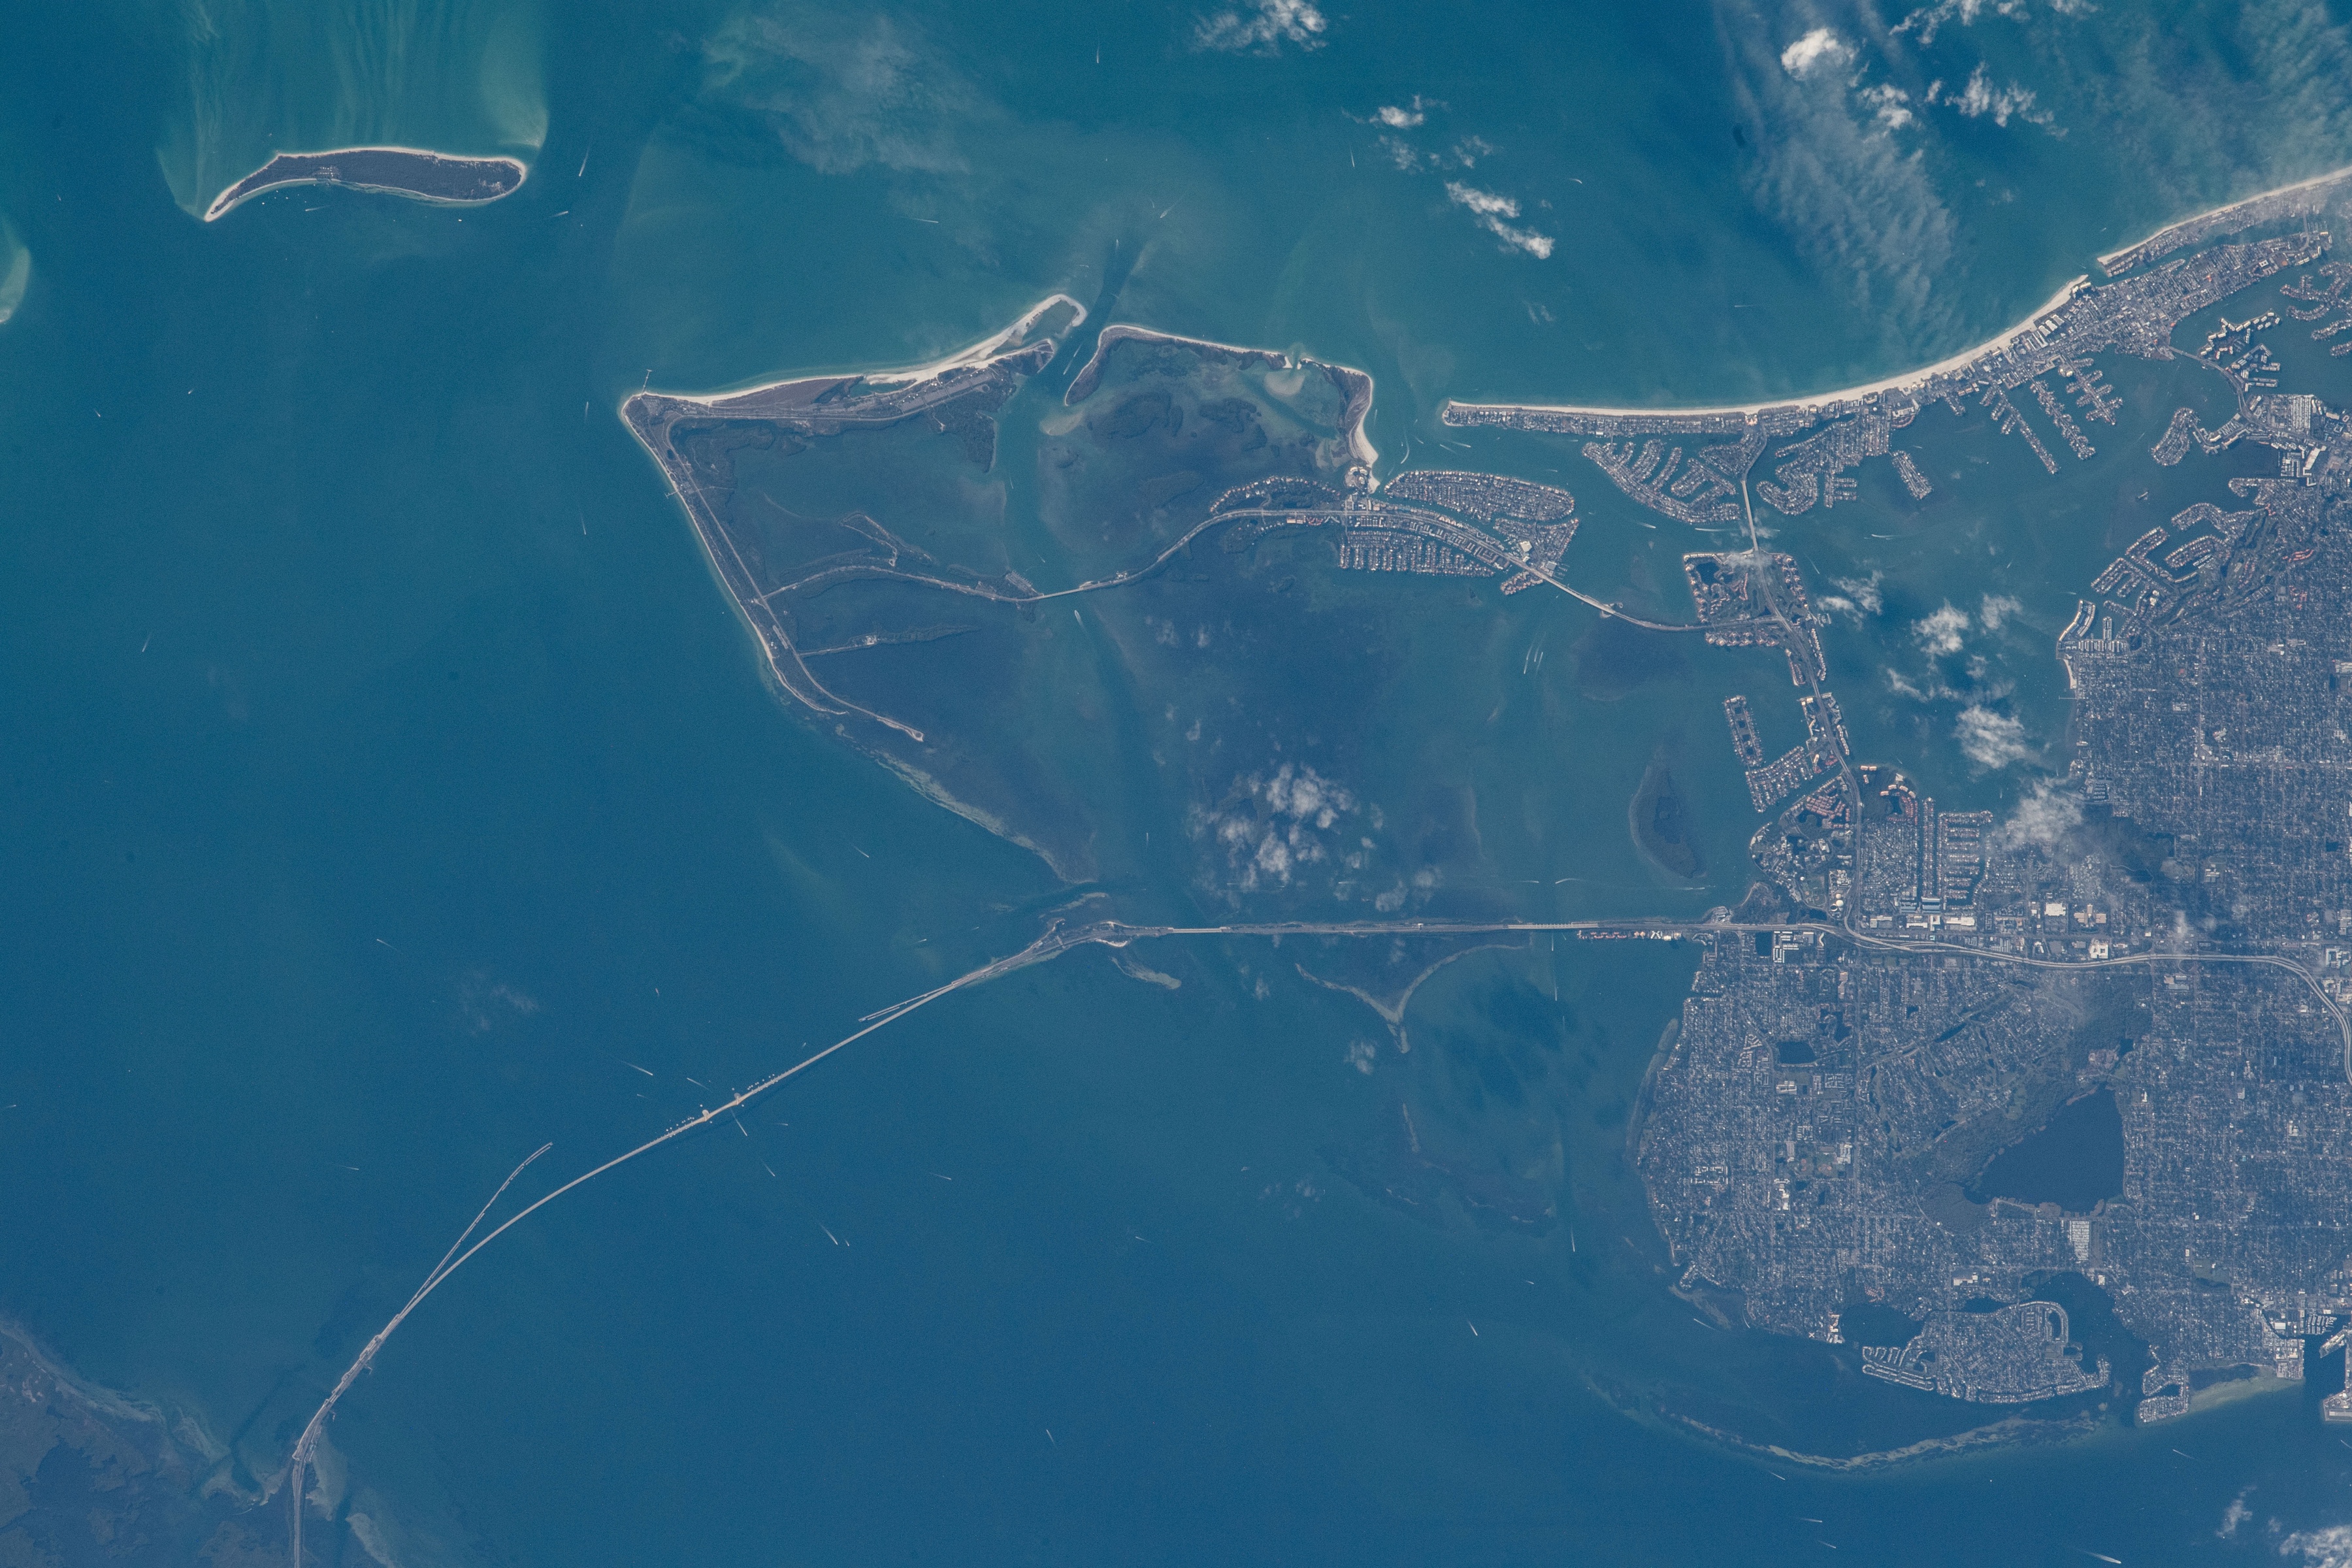
NASA ISS image of Tampa Bay
02TideNOAA CO-OPS

Water levels and astronomical tide context.
NASA Landsat image of the Suwannee River
03RiverUSGS NWIS

Stage and discharge, historic and realtime.
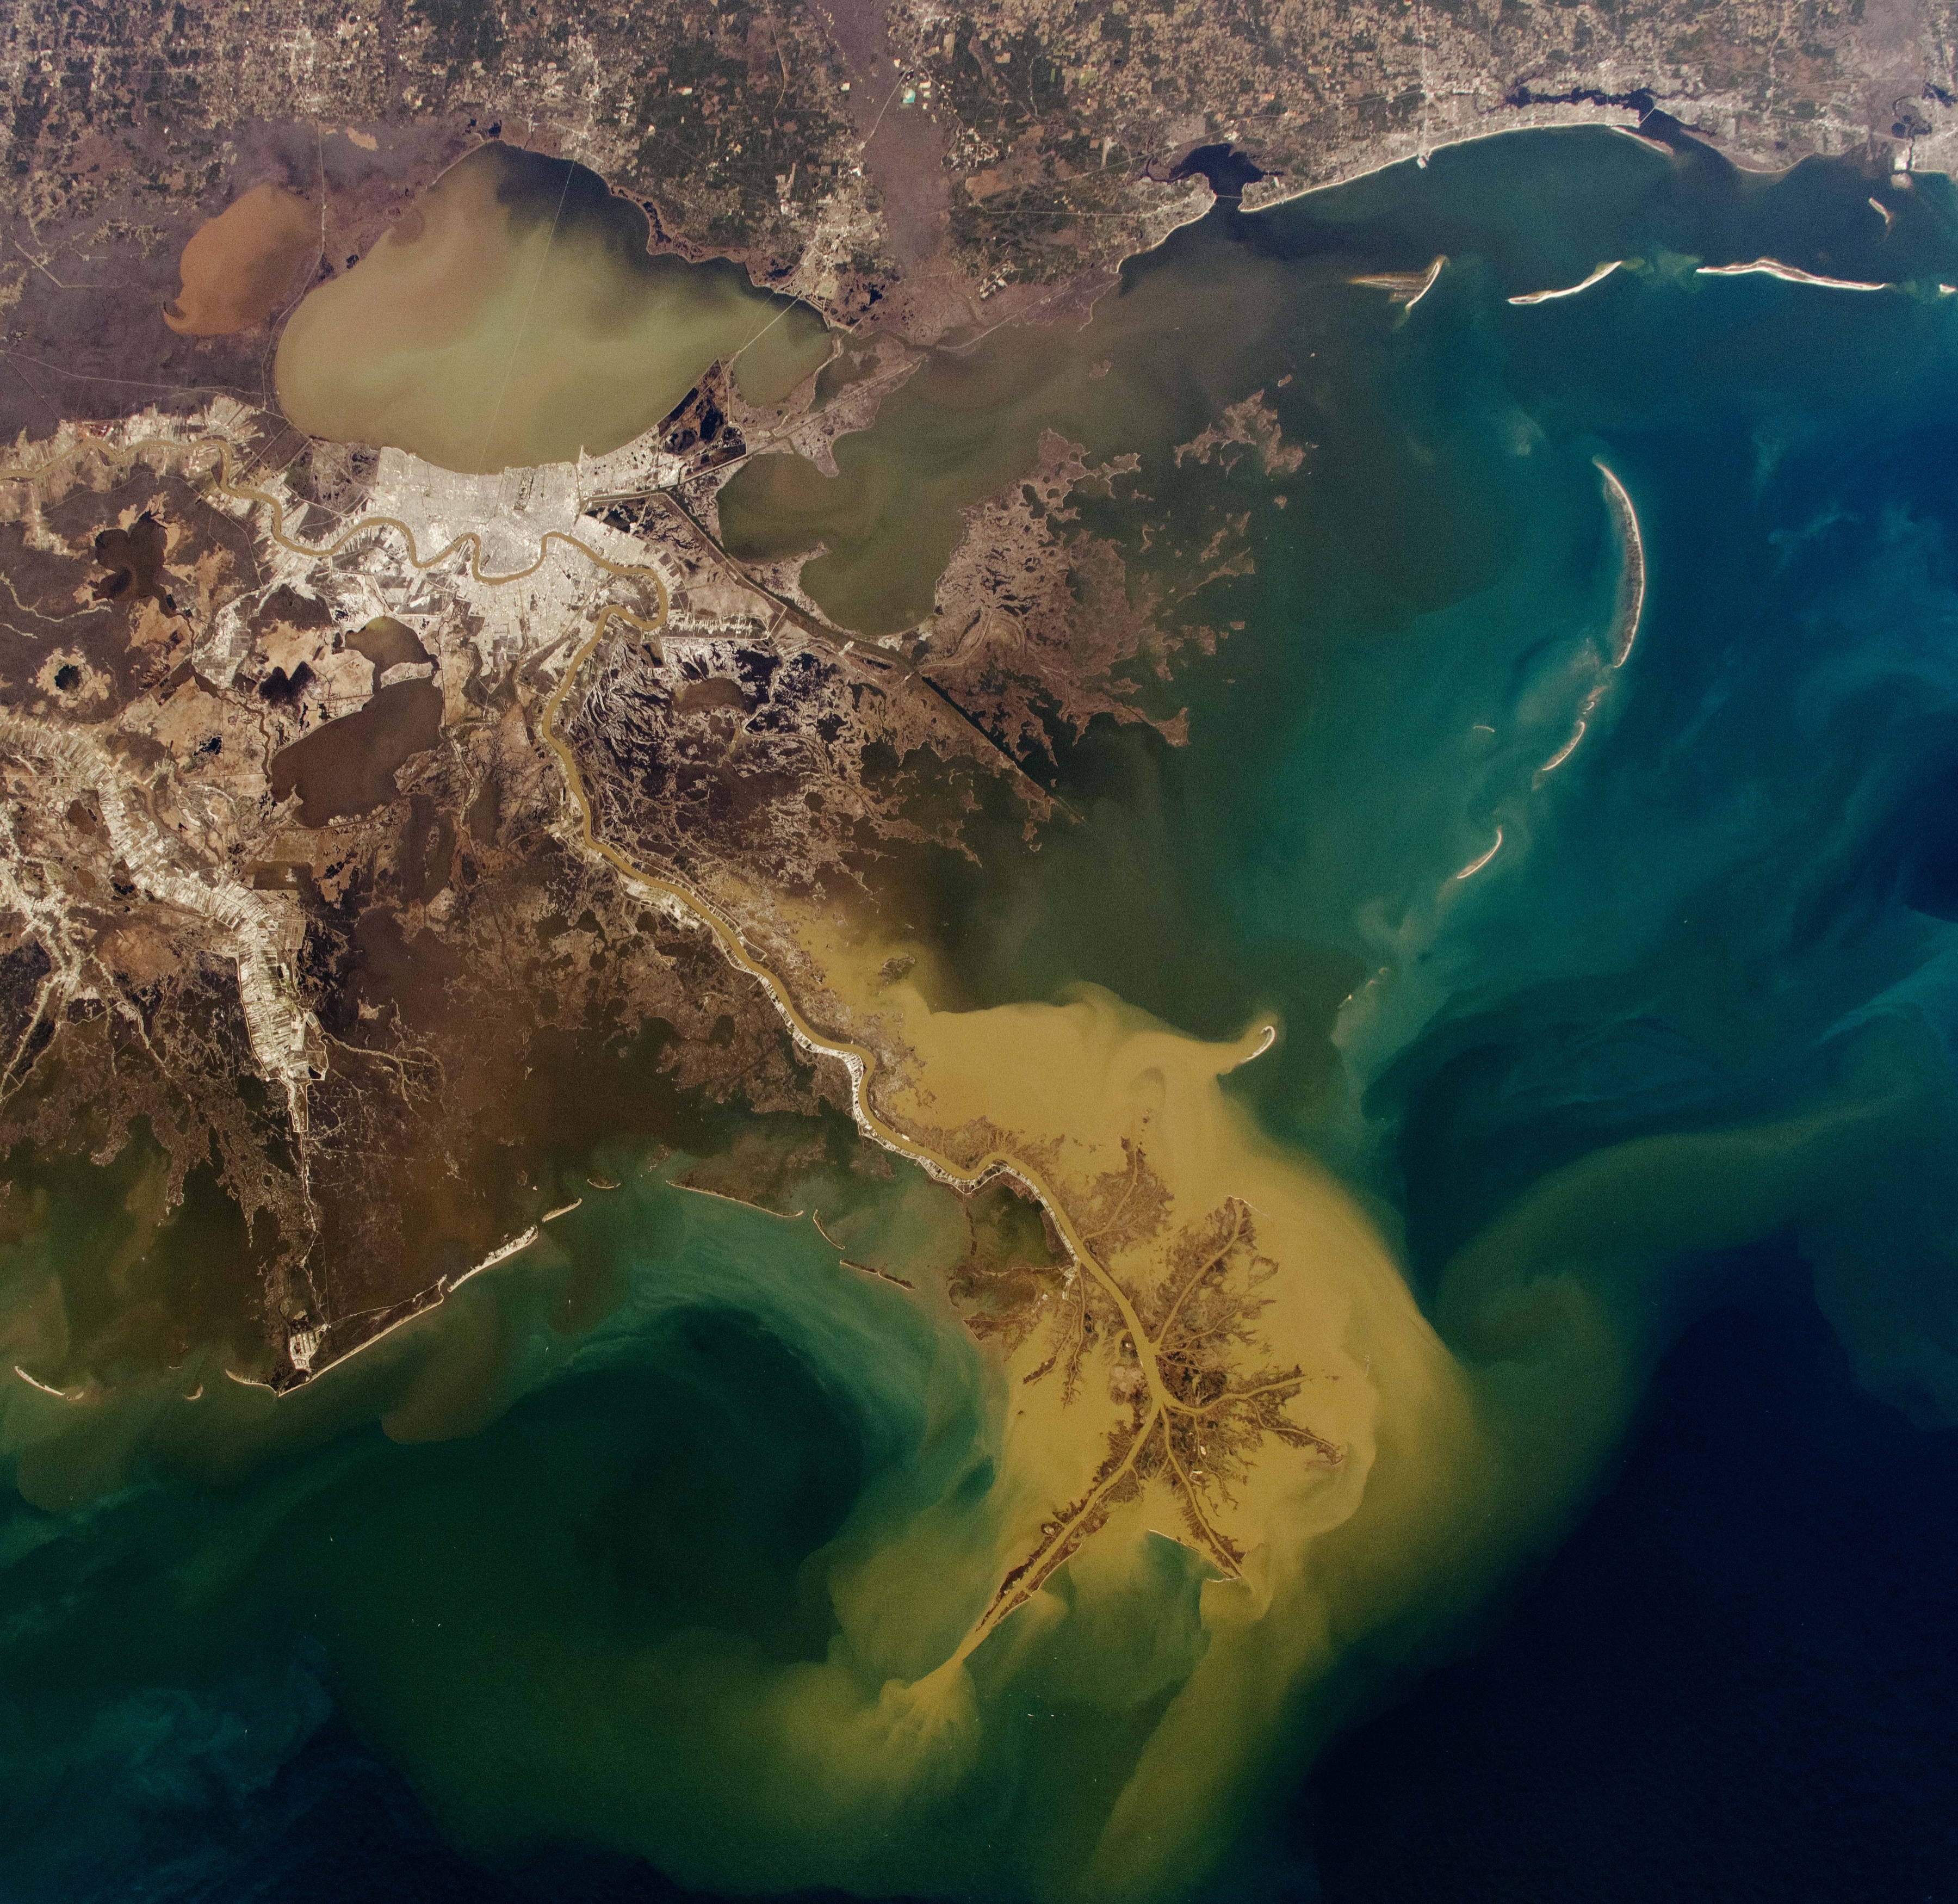
NASA ISS image of Louisiana wetlands
04TerrainUSGS 3DEP

Elevation, HAND and the places water concentrates.

Map / Score / Action / 02

One result, three ways to use it.

The output is not a static risk score. It is a time-bounded operating surface that can be inspected, compared and acted on.

Florida map context
01

Map

A compound nowcast map with lab, event, driver and alert context.

Big Bend map context
02

Score

A calibrated probability with a visible confidence range—not a false certainty.

Louisiana map context
03

Action

An ops alert and ranking so a team can inspect, stage or communicate.

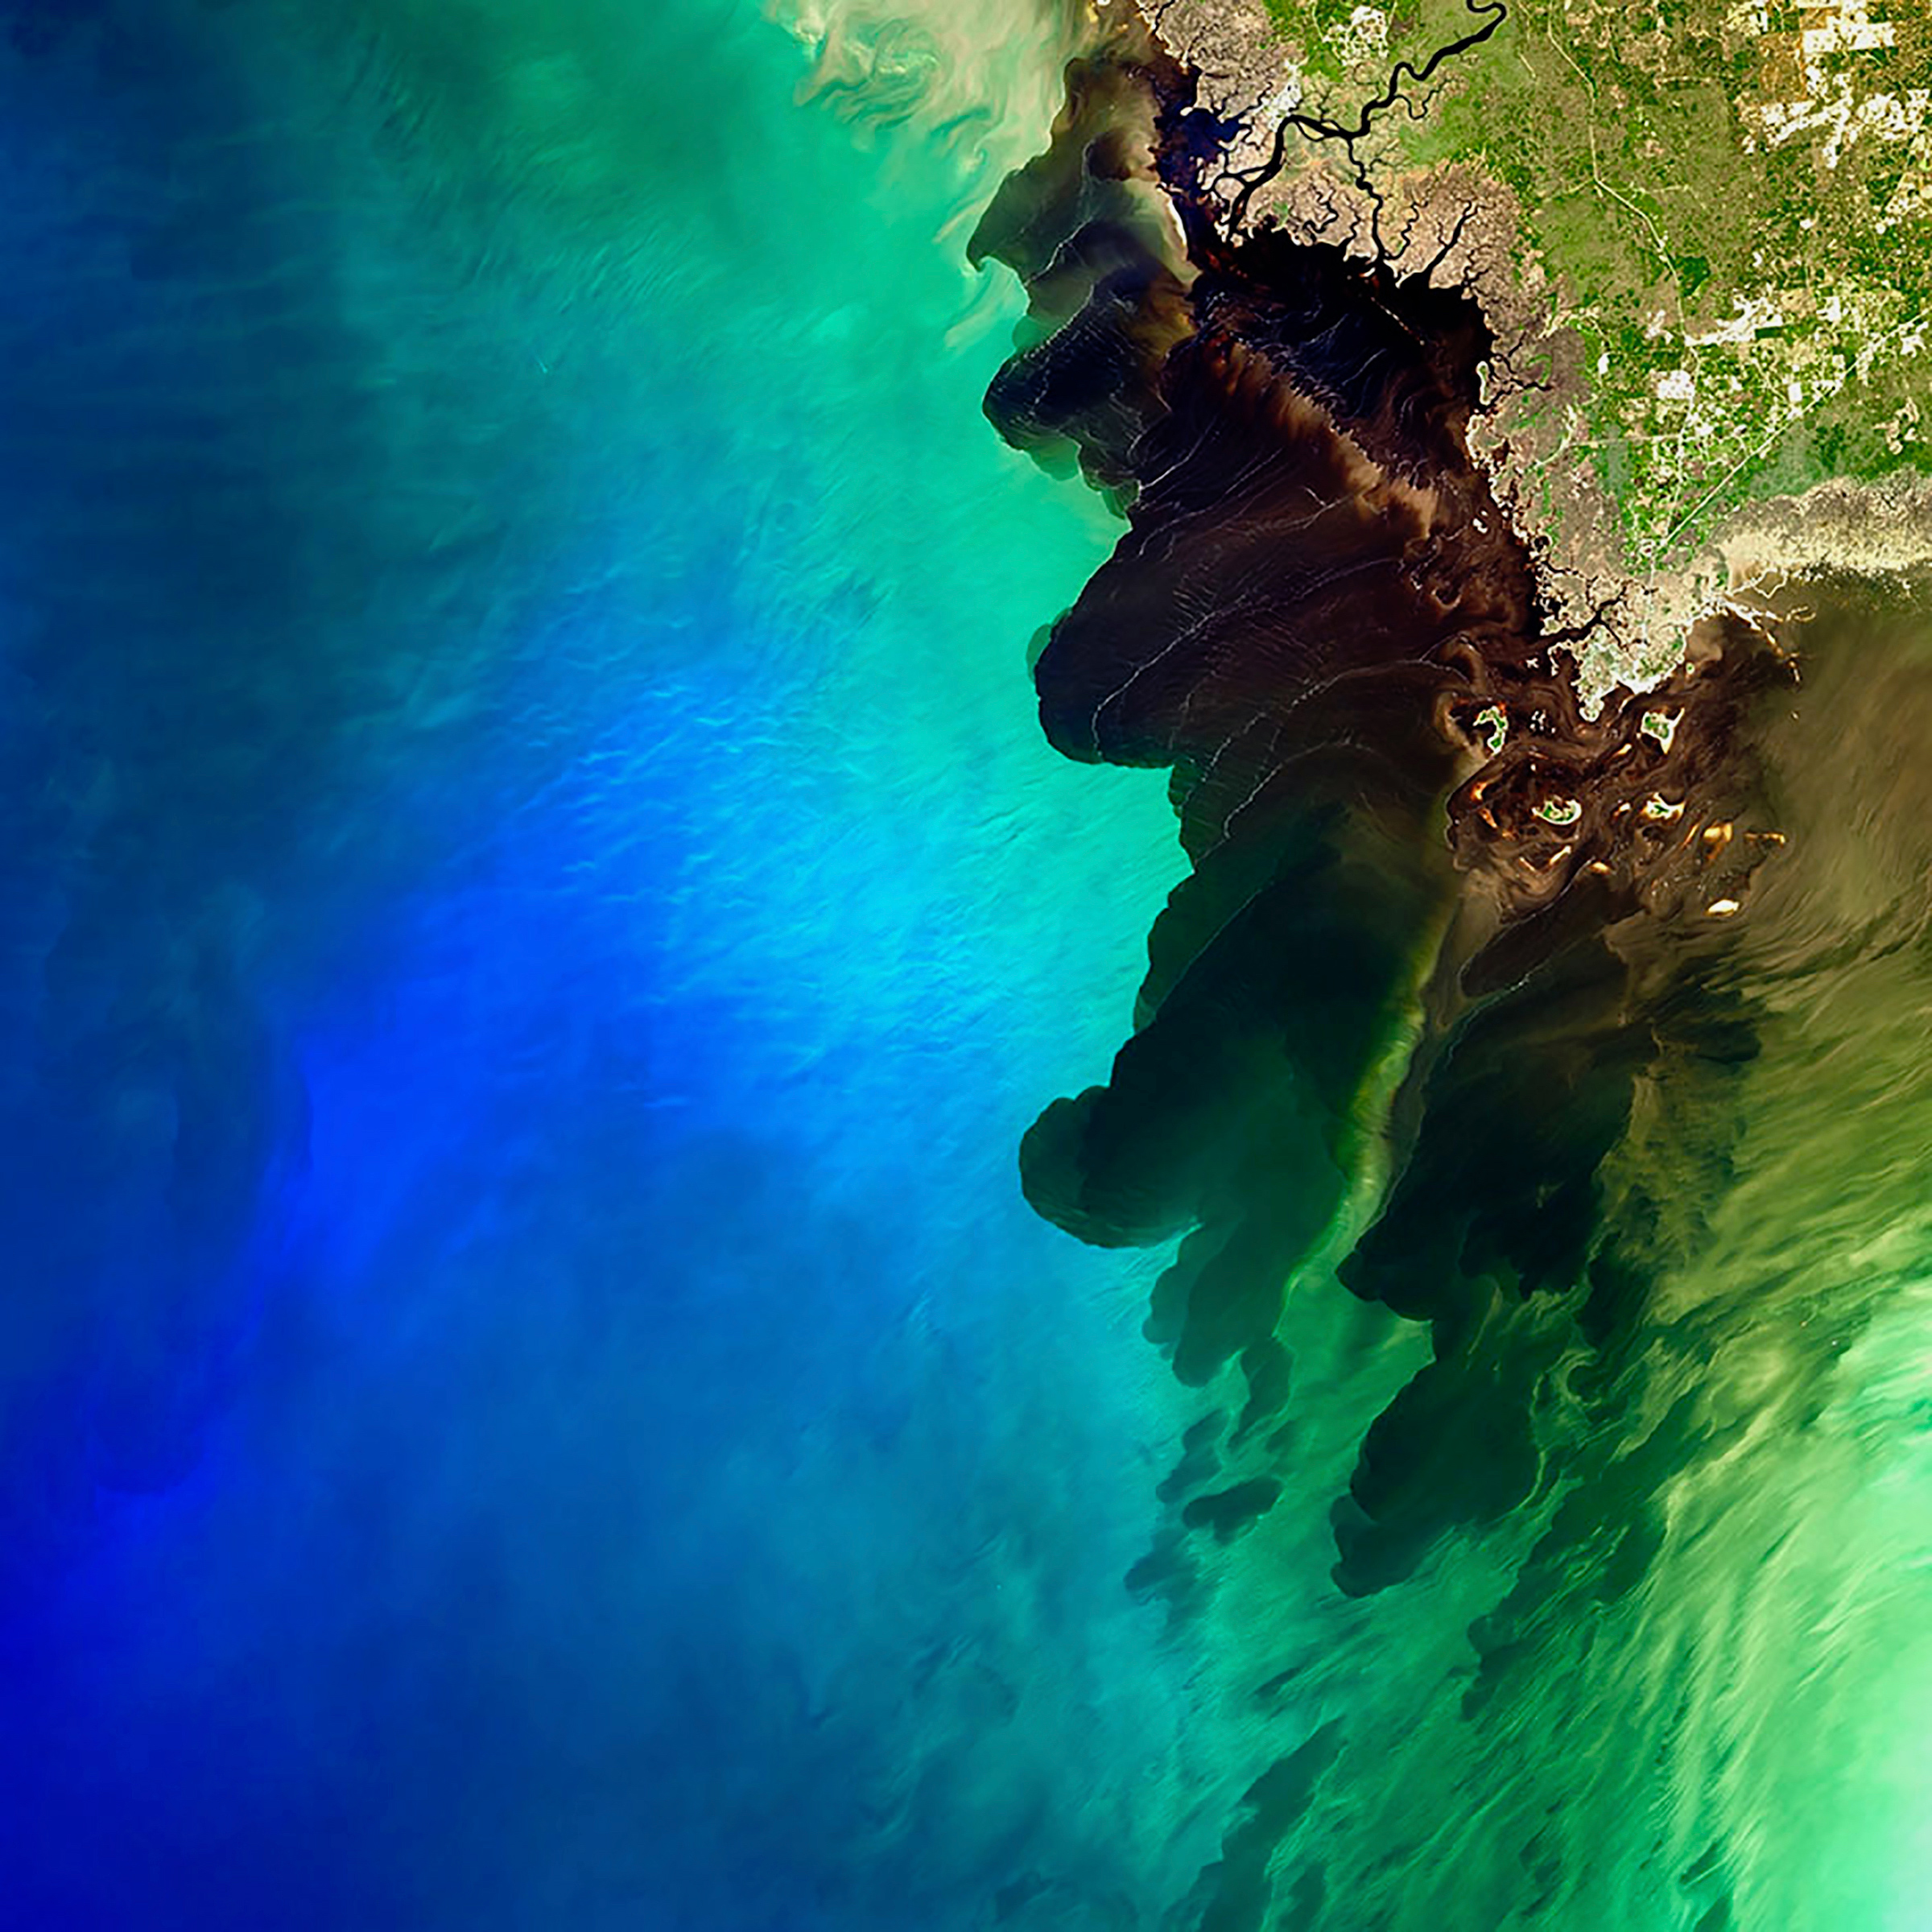
NASA Landsat image of the Suwannee River meeting the Gulf of Mexico in Florida Big Bend
NASA Landsat 8 / SuwanneeFresh water meeting coastal tide.
Confidence / 03

The range is part of the answer.

Hyperion shows the probability, confidence interval, source context and limitations together. A 76% estimate is useful because the operator can also see the range around it and what could move it.

See the operator surface
Architecture / Live intelligence

A workspace built for the decision, not the dashboard.

After access, each team gets a workspace with connected labs, event timelines, model runs, ops alerts and inspectable artifacts. The map is the center; the evidence stays attached.

Explore the operator surface
HYPERION OPS / GULF NETWORKLIVE INTELLIGENCE
Illustrative Hyperion workspace map using NASA Tampa Bay imagery
TPA-01 · 27.9506° N · 82.4572° WCOMPOUND SIGNAL / +03H
DRIVER MIX76%confidence interval
68% — 82%

LIVE INTELLIGENCERain risingTide +0.82mRunoff active
ARTIFACTOPS_ALERT.mdreport.json
Coverage today / Phase 01

What we have now.

The product is US-first with 13 active operator labs (3 canonical + 10 expansion). “Coverage” here means an operating lab with data, event context and a defined product contract—not a promise that every street has perfect ground truth.

FloridaTampa Bay coreCompound coastal nowcast · Milton opsCanonical
Big BendGulf event anchorHelene + Idalia multi-event calibrationCanonical
LouisianaNew OrleansRiver + tide compound operationsCanonical
TexasGalveston Bay / HoustonHarvey + Imelda expansion (multi-event)Expansion
North CarolinaCape Fear / WilmingtonFlorence + Matthew expansion (multi-event)Expansion
New JerseyAtlantic coast / Sandy HookSandy + Ida remnants expansion (multi-event)Expansion
VirginiaHampton Roads / NorfolkIsabel expansion · Chesapeake surgeExpansion
South CarolinaCharleston harborFlorence expansion · Carolinas compoundExpansion
New YorkNYC harbor / Long IslandSandy expansion · Mid-Atlantic surgeExpansion
MississippiGulfport / BiloxiKatrina corridor expansionExpansion
AlabamaMobile BaySally expansion · Gulf continuousExpansion
GeorgiaSavannah coastMatthew expansion · SE AtlanticExpansion
MarylandBaltimore / ChesapeakeIsabel expansion · upper BayExpansion
Event evidence already surfacedHelene 2024 · bigbendIdalia 2023 · bigbendMilton 2024 · floridaHarvey 2017 · texasImelda 2019 · texasFlorence 2018 · ncarolinaMatthew 2016 · ncarolinaSandy 2012 · newjerseyIda remnants 2021 · newjerseyIsabel 2003 · virginiaKatrina 2005 · mississippiSally 2020 · alabama
Expansion / 04

Expand by evidence,
not by map size.

The architecture is multi-region, but expansion is gated by data quality, local calibration and a responsible operating partner.

NASA ISS image of Tampa Bay
NowUnited States

Florida, Big Bend and Louisiana. Federal data stack, MVP technical freeze and live phase-one product work.
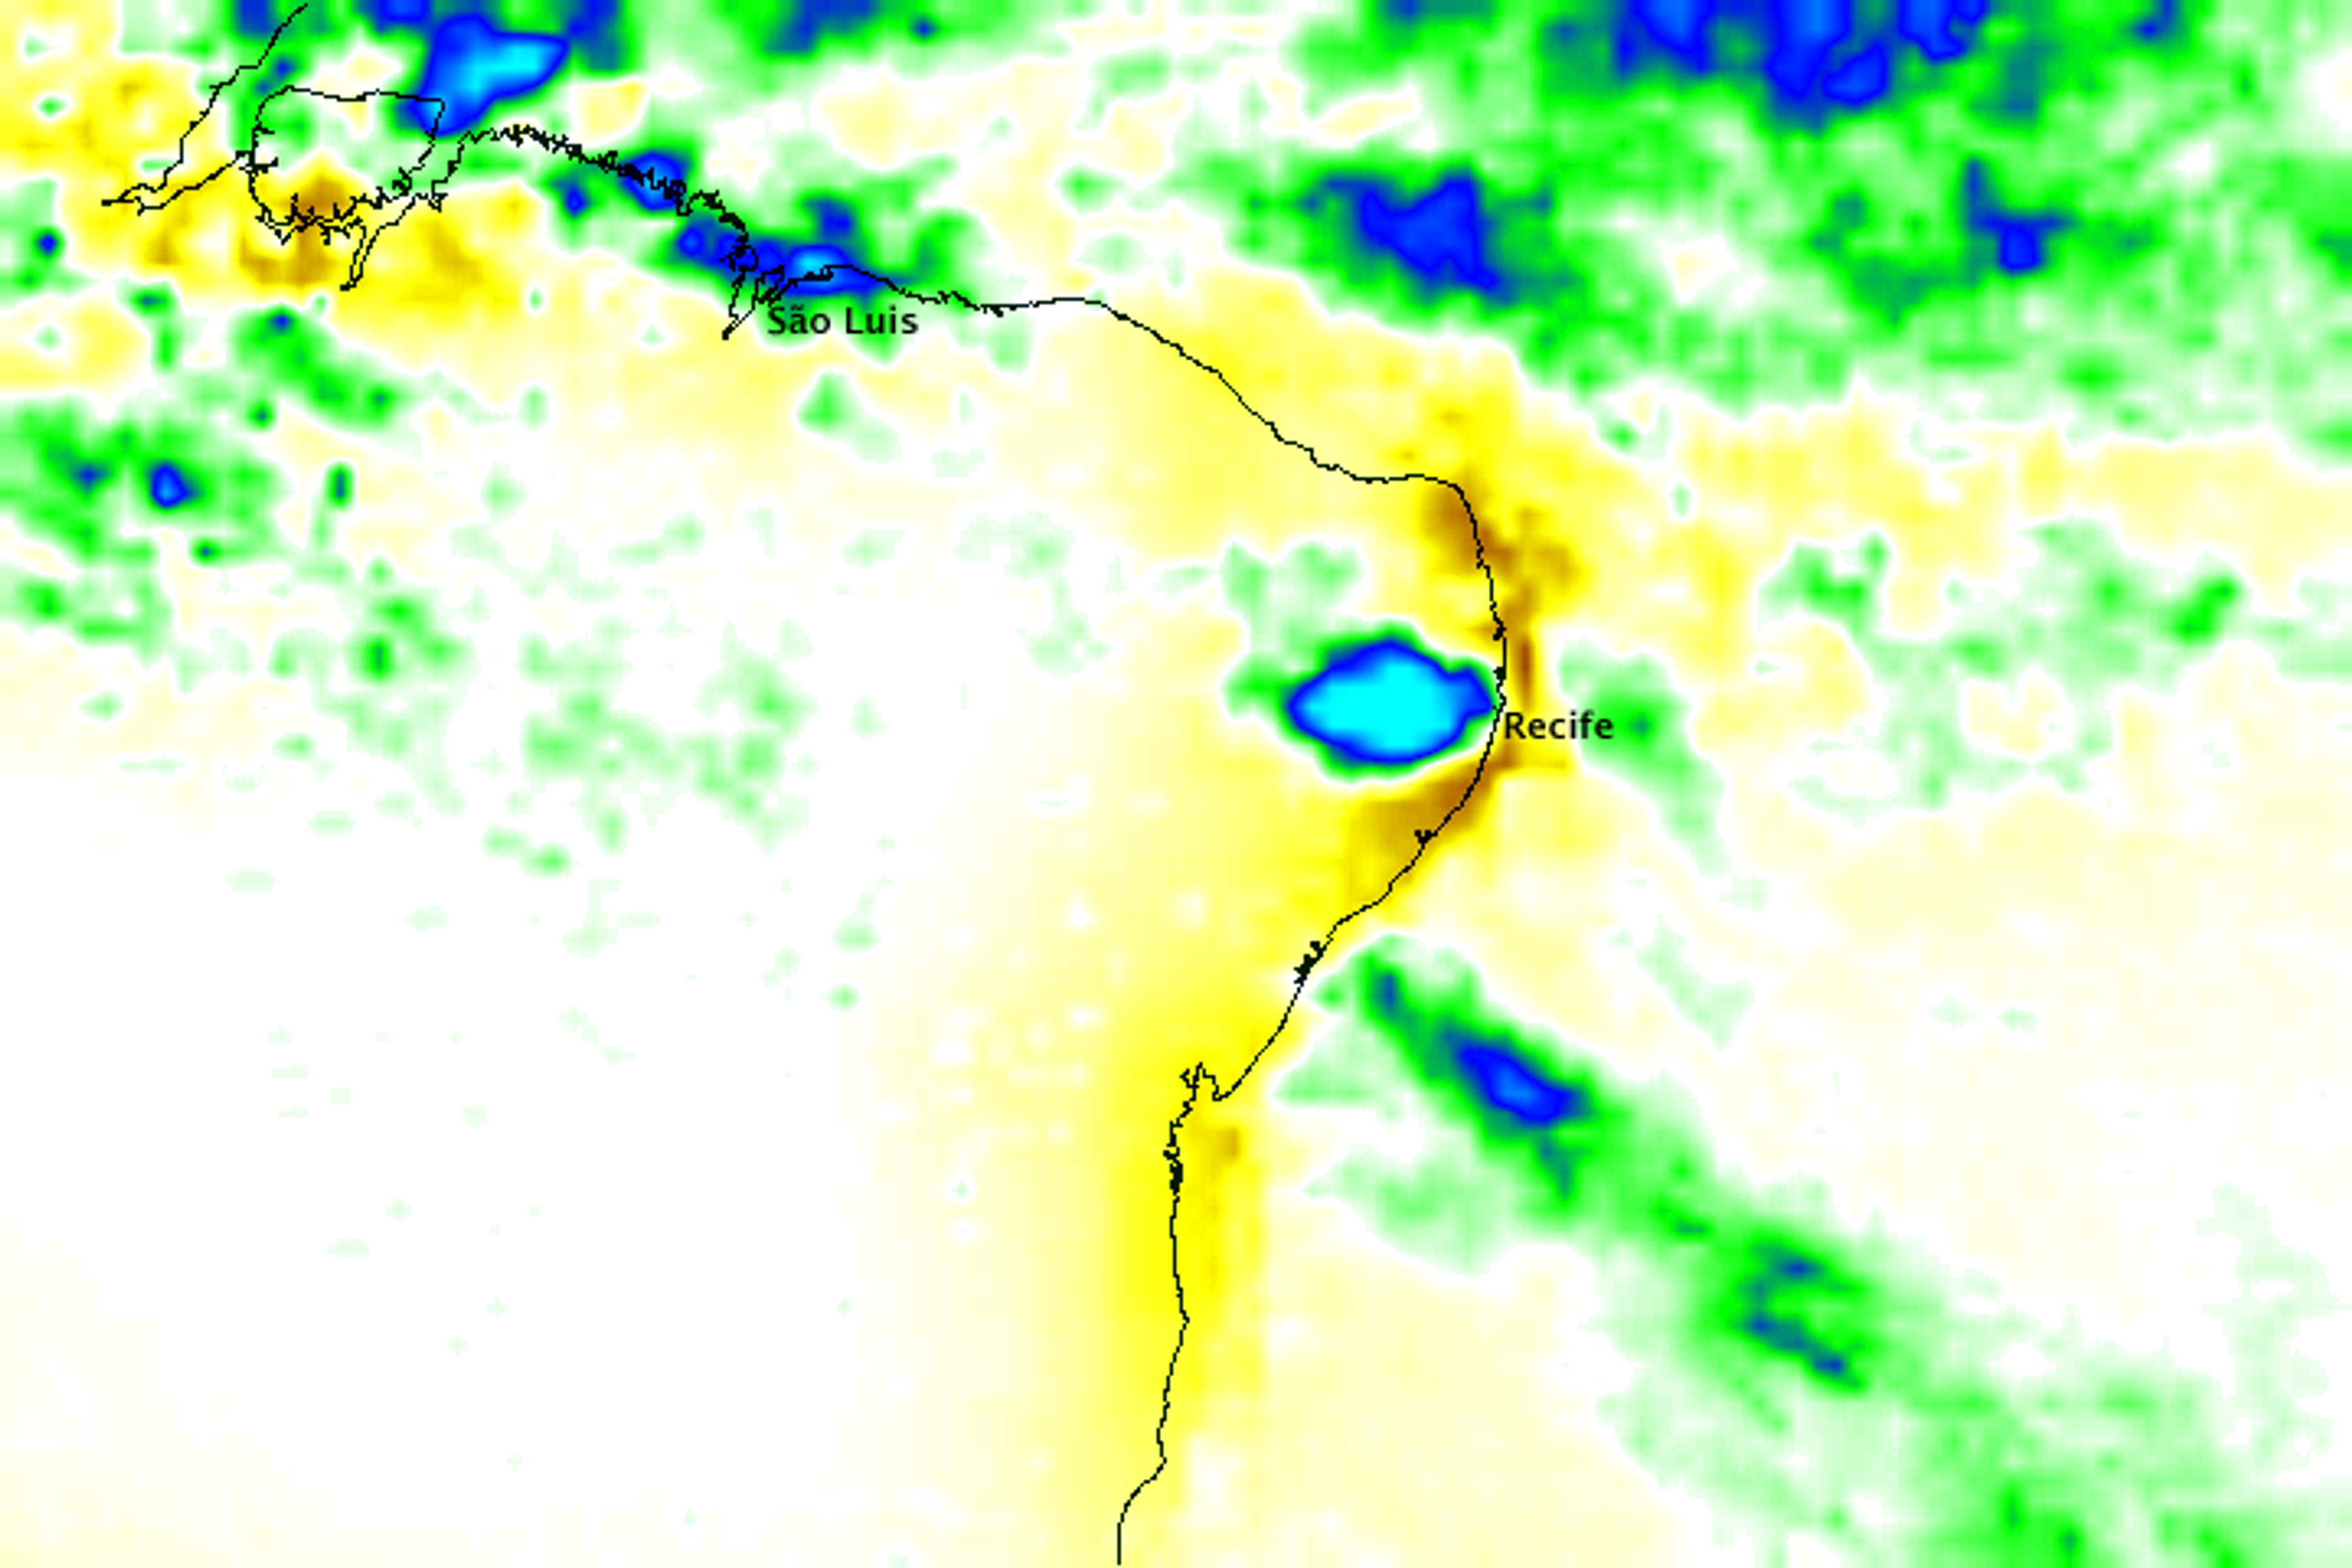
NASA TRMM rainfall map over northeastern Brazil
NextBrazil

Recife / RMR as the second launch. PE3D, Cemaden history, BNDO tide and drainage-data gates must close first.

NASA GPM global rainfall map
After validationOther countries

Future candidates are not committed yet. The same schema can move to other coastal, riverine and monsoon cities once open data, local labels and a partner are verified.

Honest product boundary

Useful in the next 0–6 hours.
Not a deterministic promise for tomorrow.

The system is built for probabilistic operations: where risk is forming, what drives it, how confident the signal is and what deserves attention next.

Enter Operator
Current run catalog: nowcast-b · baseline-a · event-helene · rain-lab · model-a · compound-ops · ops-alert · labels-fuse · coef-cal · conformal · hand-dem